For the past few months I use Tmux in a daily basis as my terminal multiplexor. It is a very handy tool that solves limitations of screen as well as provides some new features.
I even integrated a tmux session in Guake and completely disable Guake tabs!
As a systems administrator, it is essential to have a monitoring/alerting system in your infrastructure.
When something happens on one of your systems (i.e. server exhibits an ever-increasing CPU load or Apache stops responding) you should be the first to know.
For this, I use Icinga. Icinga started as a Nagios fork and introduced features like high availability that make it a compelling alternative in large environments in contrast to Nagios.
For visual notifications in desktop, Nagstamon is used that connects to a monitoring system (supports a wide variety of systems) and displays which services need attention (how many are in CRITICAL/WARNING state etc). Here is a typical image on my work desktop:
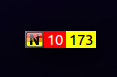
That means that 10 services are in CRITICAL state and you should take care of them while 173 have set a warning.
You can move this widget anywhere on your desktop. By clicking to it, a screen with detailed information about states is shown.
Despite the fact that Nagstamon is always present on my desktop, I would like this information to be available in my Tmux status line.
Most of my time, I am in a terminal trying to troubleshoot an issue.
The question here, is how to integrate this kind of information in the status line.
Towards this, I made a simple script that checks how many services are in CRITICAL, WARNING or UNKNOWN state and shows it in the status line. Below is the complete code
The only requirement is the presence of jq for JSON parsing. It is just a crude try.
In a nutshell it leverages JSON output provided by the Icinga Classic Web UI. The parameter servicestatustypes=28 in the request, tell Icinga to return services that are in one of the WARNING, UNKNOWN or CRITICAL states.
More info is provided in the documentation here. To use the script, simple change the variables $CGI_URL, $USERNAME and $PASSWORD to match your Icinga monitoring server and you are ready to go.

The complete result is shown on the above image.
Feel free to comment below on how to improve it.